Intro
Welcome to official MWEMU documentation, you can do scrolling down or using the direct links that are on the left.
Github repo: https://github.com/sha0coder/mwemu
![]()
What is MWEMU?
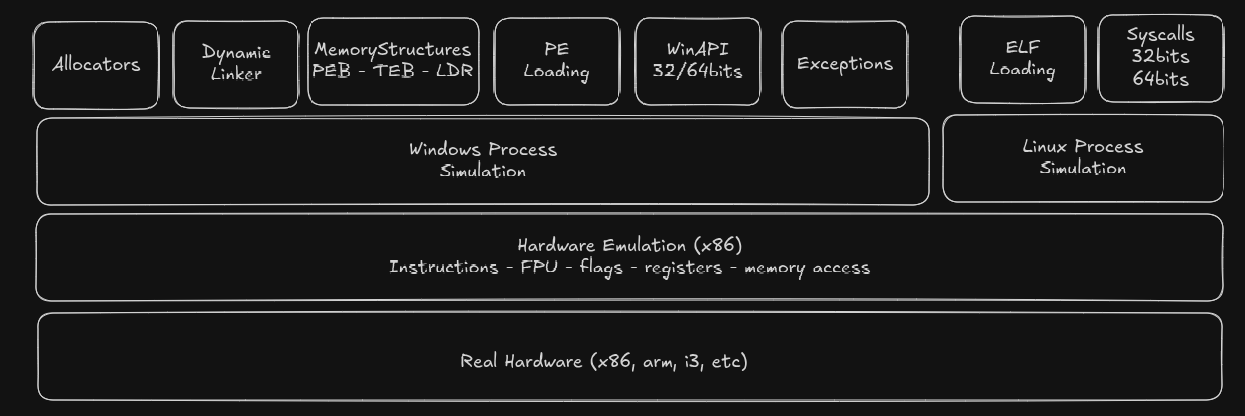
MWEMU is a hardware emulator and Windows process simulator written in pure Rust from scratch, It was created by @sha0coder and It's open source. The contributors of this software have improved the quality of the project a lot, click here to know them.
The implemented hardware is x86/x64, unlike other emulators also implemt some parts of the OS (mainly windows) because asm code soon or later is going to do system calls (WinAPI, linux syscalls, etc).
It resulted extremely useful for malware deobfuscation, but this don't replace reversing, I't needed a previous reversing to prepare well the emulation initial state, and emulate only small group of functions, like decryption, keygen etc. In some specific cases mwemu can do full-emulation, wihth simple packers, encoded shellcodes, etc.
The emulation and simulation is implemented from scratch, but the awesome Rust library iced-x86 is used to the translation from a bunch of bytes to instruction objects. I implemented more than 300 x86 instructions, flags, exceptions, some loaders PE32/PE64/ELF64/shellcode32/shellcode64 and many other stuff.
MWEMU is blazing fast and also is memory-safe thanks to the Rust magic compiler.
The 3 ways of using MWEMU
1. The first way is commandline, see commandline for more details, this is for trying full-emulation.
2. Second way is creating python scripts with pymwemu module, can be installed with pip or git.
pypi: https://pypi.org/project/pymwemu/
If you need features or bug-fixes implemented recently use the git, will need to compile the full project and then the python bindings with maturin, more details in this section pymwemu instalation
3. Third way is using the rust crate published in crates.io https://crates.io/crates/libmwemu from a rust application.
Architectures
You can run MWEMU from Windows, Linux and Mac (x86 and also m1)
But only can be emulated x86 code (32bits and 64bits) mainly for Windows, there is linux shellcode support even syscalls are implemented but regarding ELF only 64bits, only static compiled and quite basic support for now, but no problem with shellcodes.
libc can be emulated well despite it is plenty of ymm instructions, but the linker cannot be emulated totally so far, my plan is fully emulating the linker, in this case I don't need to implement the hole linking process (.got and .plt creation etc)
A bit of internals
For now, just a basic overview of the internals.
In the past I named the project SCEMU, and was stored in 3 separated repos for mwemu (the commandline) pymwemu (pyhon module) and (libmwemu) the engine where all is implemented and also it's the Rust Crate module on crates.io.
Then it was renamed to MWEMU, because SCEMU is more specific to shellcode and because it's an italian bad word.
So, now it's one repo with a crates/ folder with the 3 crates.
The tests are implemented on crates/libmwemu/src/tests/ and are described lately.
Most of files were splitted in small files.
~/s/mwemu ❯❯❯ ls crates/libmwemu/src/
banzai.rs       emu/               kuser_shared.rs
breakpoint.rs   emu_context.rs     lib.rs
colors.rs       engine/            macros.rs
config.rs       err.rs             maps/
console.rs      exception.rs       ntapi/
constants.rs    exception_type.rs  pe/
context/        flags.rs           peb/
crit_state.rs   fpu/               regs64.rs
definitions.rs  fpu.rs             script.rs
eflags.rs       global_locks.rs    serialization/
elf/            hooks.rs           structures/
syscall/        tests/             thread_context.rs
threading.rs    tools/             tracing.rs
utils.rs w      inapi/
emu/ contains emu methods and sub-bojects that are involved in the emulation itself.
In engine/ there are the implementation of all the instructions.
winapi/ contains the WinAPI implemntations divided in winapi32/ and winapi64/
there are other thigngs like contants.rs structures/ etc.
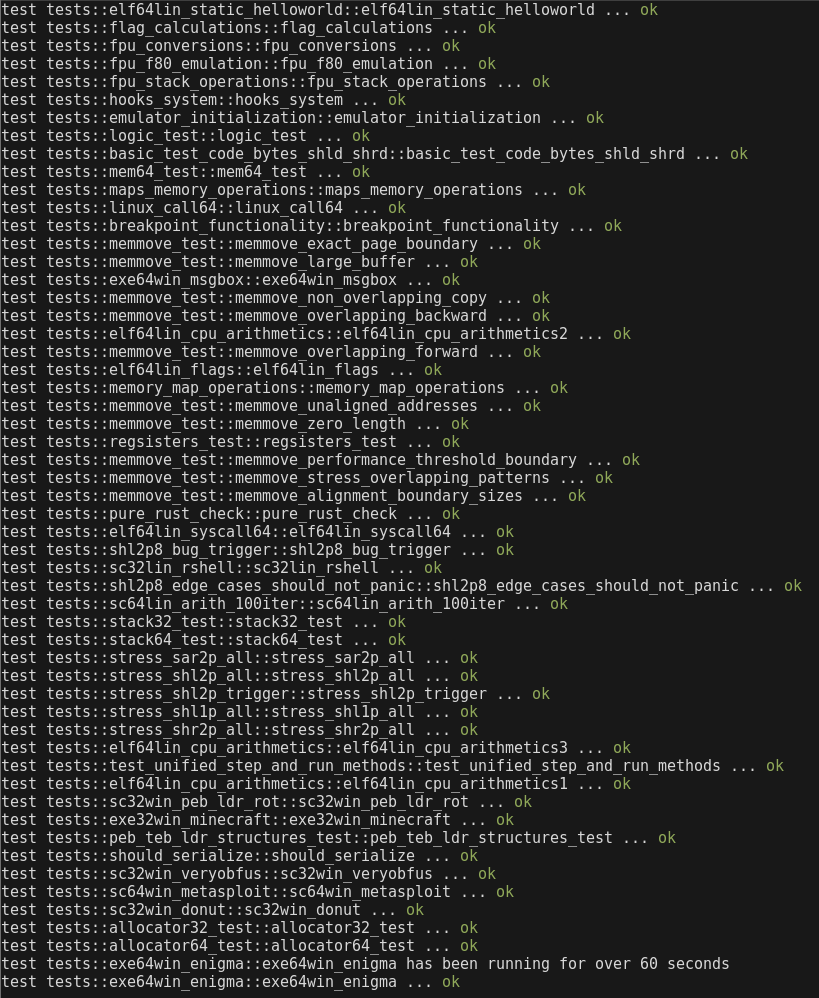
Test System
For triggering locally use make tests this downloads some binaries and launch the test system
cargo test
Don't use --release, always is more convinient do the tests without aplying the optimizations, that could ignore some type of errors. Actually the github CI is configured to do cargo test and also cargo test --release to check both modes.
Every git push or pull-request will trigger the CI in gibhut to perform all the tests in Linux, Windows and Mac. In in the case of PR is mandatory, in the case of a git push is only informative.
PR also triggers a coverage analysis of the tests, which is currently only 32%
Project Contributtors
There are also other people that suggested intereting ideas and optimizations.
Regarding wit00 it's a github glitch for git pushing having a bad configuration in git config. (the bug was reported to github)
I'm @sha0coder and I created this software to empower my reversing engineering works, and I'm sharing this because I think it's useful for some cases.
Some graphs:https://github.com/sha0coder/mwemu/graphs/contributors
Videos and pics
radare2 integration on mwemu - r2con2025
my youtube channel, there are some demos
License
Actually there are several licenses, the source code is GPLv3, but the crates.io rust module and pypi python module are MIT for having less restrictions in distributing software using libmwemu or pymwemu.
https://github.com/sha0coder/mwemu/blob/main/LICENSE
Don't hesitate in contact me for creating technologies based of this software.
email: sha0 at badchecksum dot net
MWEMU commandline tool
The commandline is a quick way of using mwemu, and there are many features like register/memory/call/string tracing or capturing emulation moments.
If the packer is simple probably can be full-emulated using the commandline tool, but if you need more control use pymwemu and for total control libmwemu.
In rust you can compile and exec together with cargo run, use --release mode for faster execution, example:
❯❯❯ cargo run --release -- -6 -f file -vv -c 100
This is equivalent of doing:
❯❯❯ cargo build --release
❯❯❯ target/release/mwemu -6 -f file -vv -c 100
MWEMU Installation
1. First you need to install Rust and Cargo, and the best way is using rustup.
For instance in linux or mac:
❯❯❯ curl --proto '=https' --tlsv1.2 -sSf https://sh.rustup.rs | sh
In the default setup binaries are in ~/.cargo/bin/ but you need to add this to the path, ideally on last section of the path.
❯❯❯ export PATH="$PATH:/home/username/.cargo/bin/"
The installer says how to put in the bashrc or other shells rc.
2. Then there are 2 options to install this
-
Install from crates.io (is more convininent second option)
Shell ❯❯❯ cargo install mwemu -
The recommended way is cloning the github repo and compile from it, with Cargo it's simple.
Shell git clone https://github.com/sha0coder/mwemu.git cargo build --release make tests
--help
Use help option for viewing the commandline options, note that the before the "--" there are cargo flags and after the "--" are the parameters of the program, in this case mwemu commandline.
~/s/mwemu ❯❯❯ cargo run --release -- --help Finished `release` profile [optimized] target(s) in 0.06s
Running `target/release/mwemu --help`
MWEMU emulator for malware 0.7.12
@sha0coder
USAGE:
mwemu [FLAGS] [OPTIONS]
FLAGS:
-6, --64bits enable 64bits architecture emulation
--banzai skip unimplemented instructions, and keep up emulating what can be emulated
--call enable call tracer
--entropy display changes in the entropy
--flags trace the flags hex value in every instruction.
-F, --fpu trace the fpu states.
-h, --handle handle Ctrl+C to spawn console
--help Prints help information
-l, --loops show loop interations, it is slow.
--multithread enable multithread emulation
-n, --nocolors print without colors for redirecting to a file >out
-p, --stack_trace trace stack on push/pop
-t, --test test mode
-m, --trace_memory trace all the memory accesses read and write.
-r, --trace_registers print the register values in every step.
--version Prints version information
-v, --verbose -vv for view the assembly, -v only messages, without verbose only see the api calls and
goes faster
OPTIONS:
-A, --args
Full Emulation
Main options are:
-
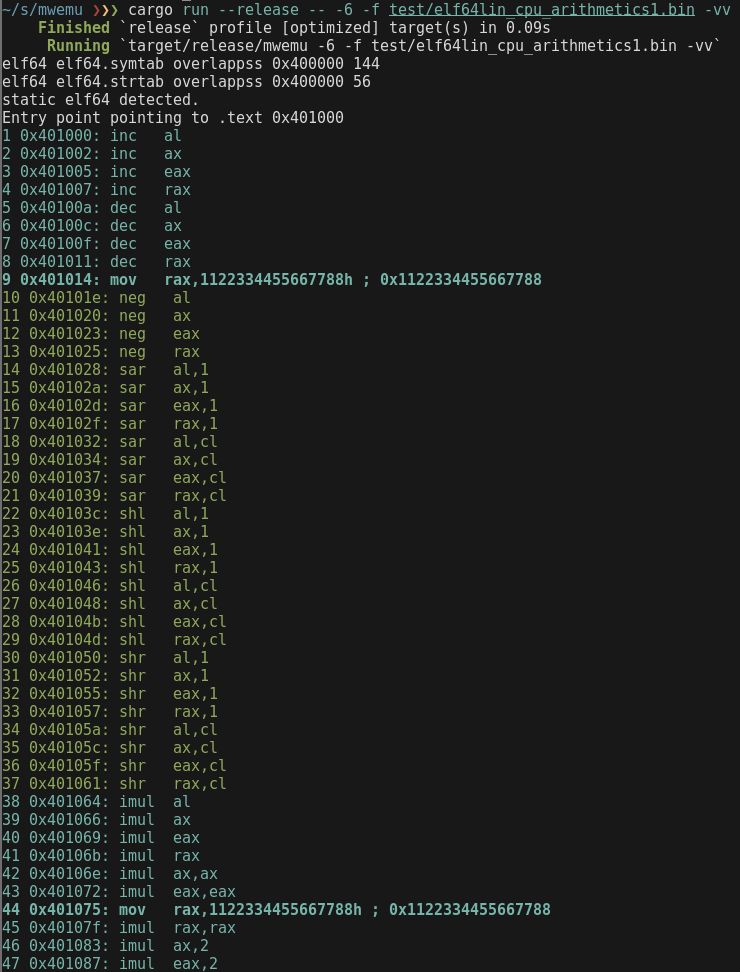
-6 for 64bits mode (otherwise would be 32bits)
-
-f for selecting file path.
-
-vv for vieweing the emulated assembler. (emulation is faster with no verbosity, in this case only shows the api calls)
❯❯❯ cargo run --release -- -6 -f test/elf64lin_cpu_arithmetics1.bin -vv
Capturing a moment
MWEMU displays always the number of emulated instructions, and this is a unique identificator of a moment.
The moment 1 is the first assembly instruction, if you add the flag -c 1 the emulator will stop before emulating instruction 1
~/s/mwemu ❯❯❯ cargo run --release -- -6 -f test/elf64lin_cpu_arithmetics1.bin -vv -c 1
    Finished `release` profile [optimized] target(s) in 0.07s
     Running `target/release/mwemu -6 -f test/elf64lin_cpu_arithmetics1.bin -vv -c 1`
static elf64 detected.
Entry point pointing to .text 0x401000
-------
1 0x401000: inc   al
--- console ---
=>
The instruction 1 will not be colored, this means that that instruction is going to be emulated in next step.
This spawns the console in that emulator state, and you can press enters to emulate steps or "h" command for viewing options.
If verbose mode is not set, only WinAPI, syscalls etc will be displayed, but there will be also a number that represent the emulated instructions until that state.
There is the option of stopping the emulator at specific address with uppercase "-C addr" but note that the address can be triggered multiple times and is not an unique identificator like the -c moment
Verbosity
There are 4 verbosity levels:
-
0: Don't use any -v for minimum verbosity, only WinAPI calls and syscalls will be printed.
-
1: Use -v for viewing also some messages like, polymorfic code detected etc.
-
2: Use -vv for viewing also the assembly code, mwemu will print every assembly instruction, this makes slower the emulation.2: Use -vv for viewing also the assembly code, mwemu will print every assembly instruction, this makes slower the emulation.
-
3: Use -vvv for also viewing every "rep" interaction, in instruction with rep prefix like "rep movzx" will print one line for every step of the rep loop.
Use -V or --verbose_at for enabling verbose mode at specific point.
The verbose mode is automatically enabled 100 instructions previous to the configured -c moment to stop.
Logging
It's possible to redirect the output to a file, ie:
❯❯❯ cargo run --release -- -6 -f test/elf64lin_cpu_arithmetics1.bin -vv -c 1 > /tmp/log
But note that colors are terminal escape bytes and will be logged making parsing more difficult, if you do cat /tmp/log you will see the colors but if you use an editor you will see those bytes
It is more convinient using --log option for a clean logs.
❯❯❯ cargo run --release -- -6 -f test/elf64lin_cpu_arithmetics1.bin -vv -c 1 --log /tmp/log
Initialize registers
There are some cases like emulating dlls or chunk of code that needs some initial values in the registers.
The commandline tool allows to set registers using those options:
        --mxcsr <MXCSR>                           set mxcsr register
        --r10 <R10>                               set r10 register
        --r11 <R11>                               set r11 register
        --r12 <R12>                               set r12 register
        --r13 <R13>                               set r13 register
        --r14 <R14>                               set r14 register
        --r15 <R15>                               set r15 register
        --r8 <R8>                                 set r8 register
        --r9 <R9>                                 set r9 register
        --rax <RAX>                               set rax register
        --rbp <RBP>                               set rbp register
        --rbx <RBX>                               set rbx register
        --rcx <RCX>                               set rcx register
        --rdi <RDI>                               set rdi register
        --rdx <RDX>                               set rdx register
        --rflags <RFLAGS>                         set rflags register
        --rip <RIP>                               set rip register
        --rsi <RSI>                               set rsi register
        --rsp <RSP>                               set rsp register
But note that colors are terminal escape bytes and will be logged making parsing more difficult, if you do cat /tmp/log you will see the colors but if you use an editor you will see those bytes
It is more convinient using --log option for a clean logs.
❯❯❯ cargo run --release -- -6 -f test/elf64lin_cpu_arithmetics1.bin -c 1 --rax 0x123 --rbx 0x1337
Finished `release` profile [optimized] target(s) in 0.08s
Running `target/release/mwemu -6 -f test/elf64lin_cpu_arithmetics1.bin -c 1 --rax 0x123 --rbx 0x1337`
static elf64 detected.
Entry point pointing to .text 0x401000
--- console ---
=>r rax
rax: 0x123 291
=>r rbx
rbx: 0x1337 4919
Trace Registers
Use option -R <registers to trace> to trace some registers
❯❯❯ cargo run --release -- -6 -f test/elf64lin_cpu_arithmetics1.bin -vv -R rax,rsp
...
57 0x4010a2: rcr   al,1
58 rax: 0x82f61001 2197164033
58 rsp: 0x7fffffffe270
58 0x4010a4: rcr   ax,1
59 rax: 0x82f60800 2197161984
59 rsp: 0x7fffffffe270
59 0x4010a7: rcr   eax,1
60 rax: 0xc17b0400 3246064640
60 rsp: 0x7fffffffe270
60 0x4010a9: rcr   rax,1
61 rax: 0x60bd8200 1623032320
61 rsp: 0x7fffffffe270
61 0x4010ac: rcr   al,cl
62 rax: 0x60bd8200 1623032320
62 rsp: 0x7fffffffe270
62 0x4010ae: rcr   ax,cl
63 rax: 0x60bd8200 1623032320
63 rsp: 0x7fffffffe270
63 0x4010b1: rcr   eax,cl
64 rax: 0x60bd8200 1623032320
64 rsp: 0x7fffffffe270
64 0x4010b3: rcr   rax,cl
65 rax: 0x60bd8200 1623032320
65 rsp: 0x7fffffffe270
65 0x4010b6: mov   eax,90909090h ; 0x90909090
66 rax: 0x90909090 2425393296
66 rsp: 0x7fffffffe270
66 0x4010bb: mov   edx,90909090h ; 0x90909090
67 rax: 0x90909090 2425393296
67 rsp: 0x7fffffffe270
67 0x4010c0: mov   ecx,0 ; 0x0
68 rax: 0x90909090 2425393296
68 rsp: 0x7fffffffe270
68 0x4010c5: shrd  eax,edx,cl
69 rax: 0x90909090 2425393296
69 rsp: 0x7fffffffe270
69 0x4010c8: ret ; ret-addr: 0x0 ret-value: 0x90909090
You can trace one or multiple registers at same time with -R option but with no spaces between registers.
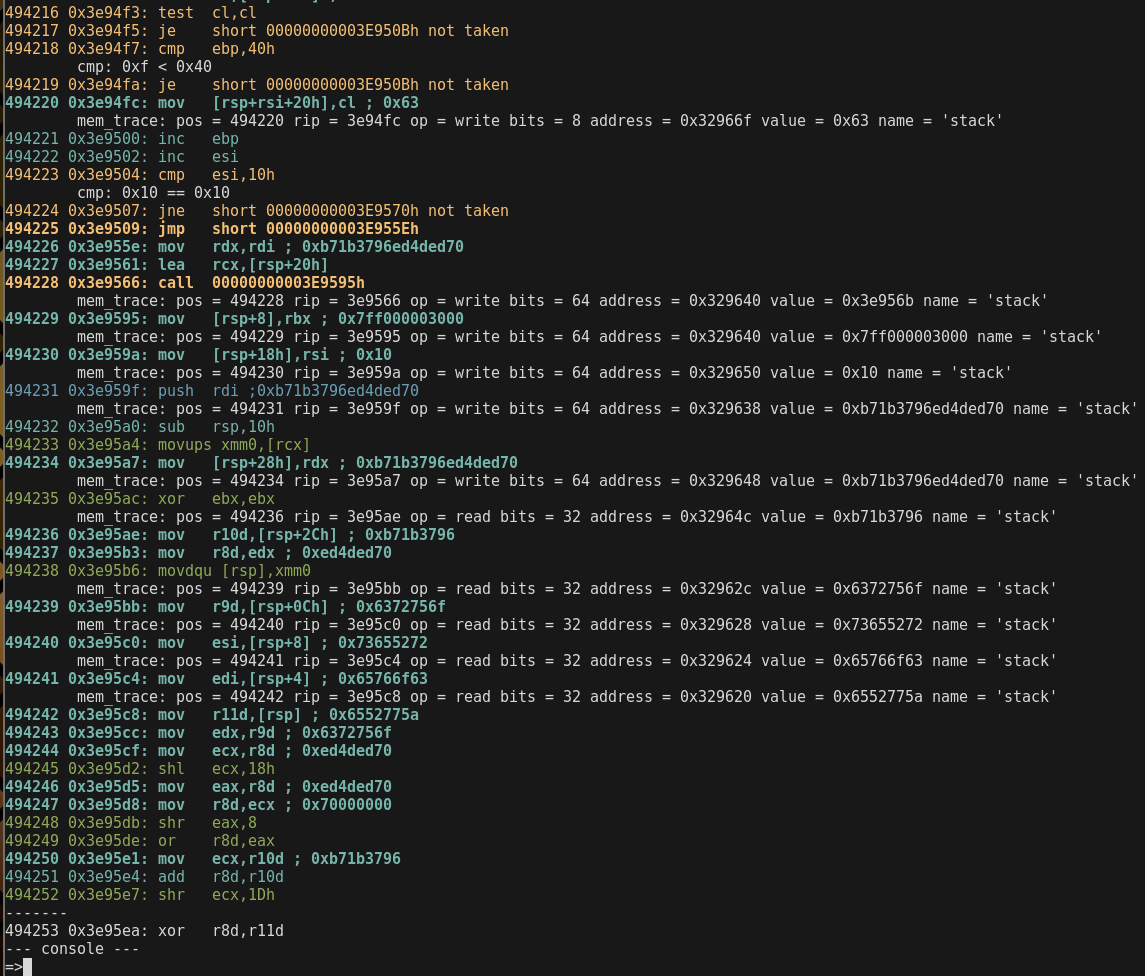
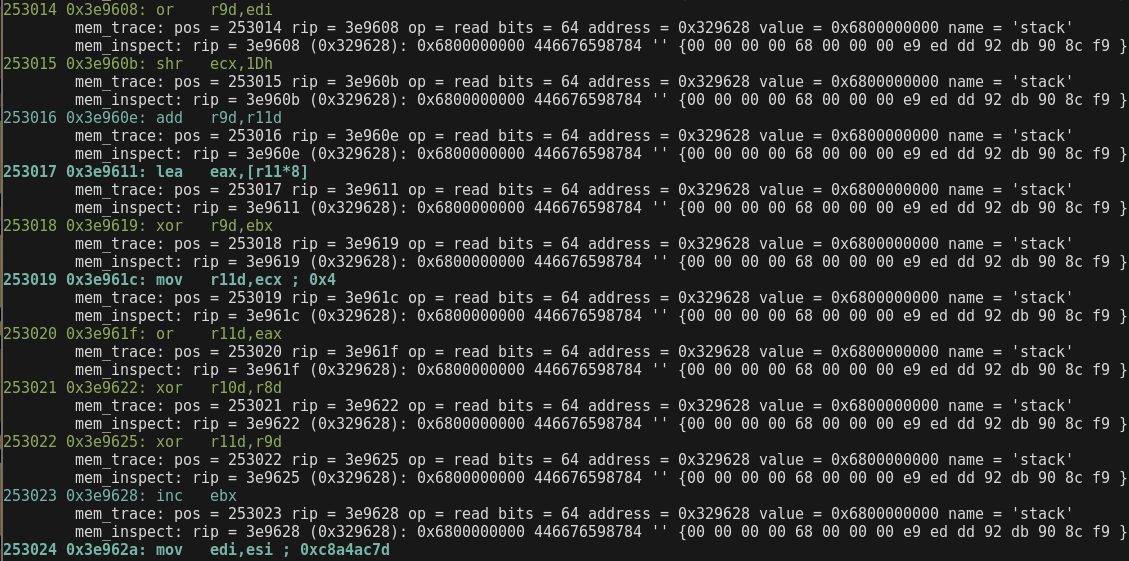
Trace Memory
There are 2 ways of tracing memory:
-
-m for tracing all the memory read and writes. (optionally -S moment enable the tracer from specific moment)
-
-i 'dword ptr [eax + 0x8]' inspect mode allows many expressions but not all the combinations.
❯❯❯ cargo run --release -- -6 -f test/sc32win_donut.bin -vv -m -c 494253 -S 490000
❯❯❯ cargo run --release -- -6 -f test/sc32win_donut.bin -vv -m -i 'qword ptr [rsp + 0x8]'
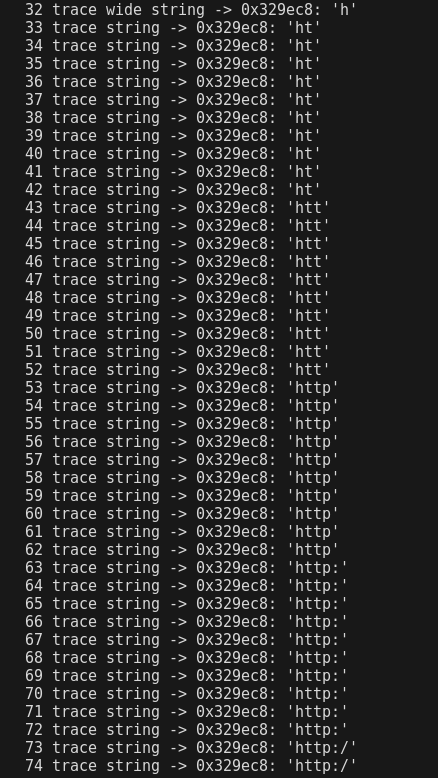
Trace String
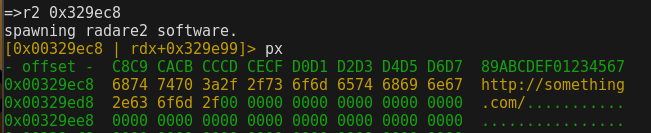
having the address of the string to trace, use -s <addr> to trace it
❯❯❯ cargo run --release -- -6 -f test/sc64lin_strgen.bin -vv -s 0x329ec8
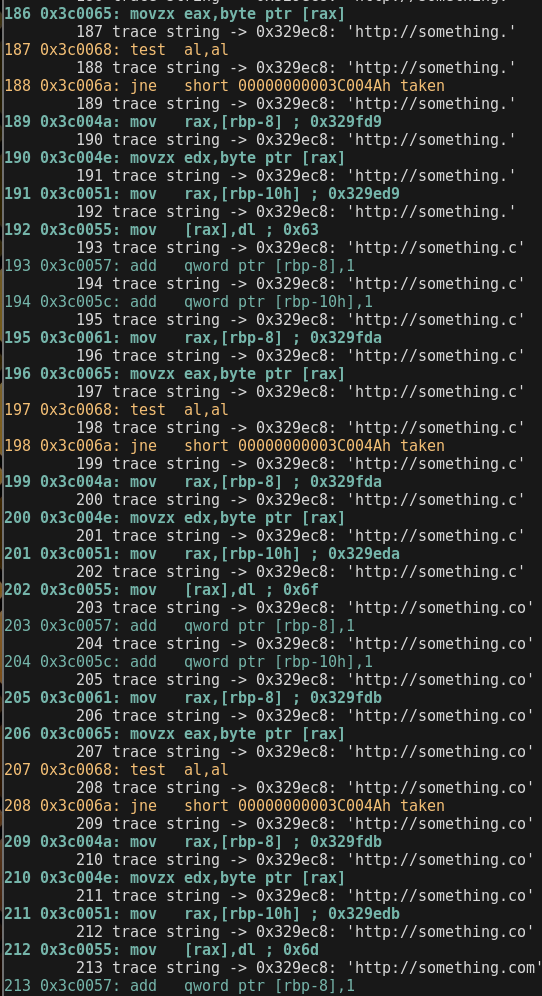
Doing full verbose of millions of instructions is slower than non verbose mode, so let's enable the verbose mode only when it's needed.
❯❯❯ cargo run --release -- -6 -f test/sc64lin_strgen.bin -s 0x329ec8 -V 191
Other option is using tracers with no verbose mode.
❯❯❯ cargo run --release -- -6 -f test/sc64lin_strgen.bin -s 0x329ec8
Trace Function Calls
Following the call paths can be useful when combining emulation with static analysis to see where we are coming from.
❯❯❯ cargo run --release -- -6 -f test/exe64win_enigma.bin --call
In this case, it is more convinient not to use verbose mode.
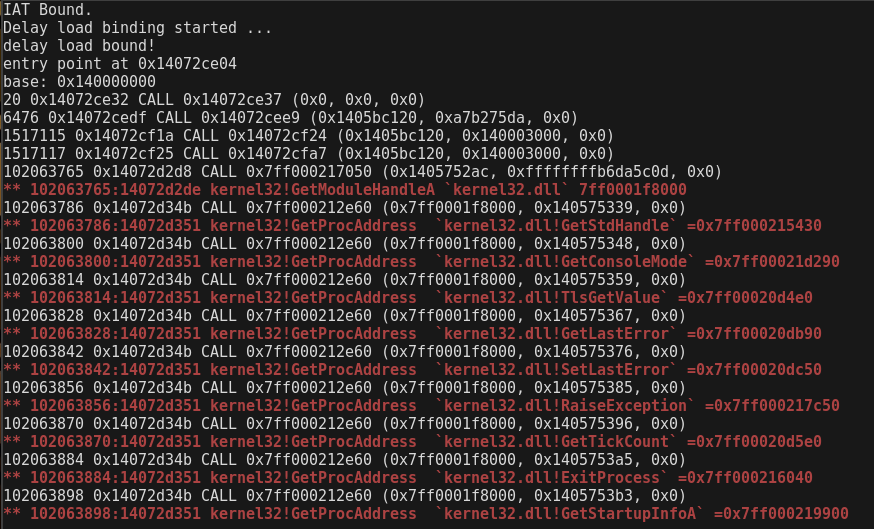
Interactive Console
With the option -c <num> mwemu stops the emulation when will reached that num of emulated instructions, then spawn a console.
For instance, we don't want to emulate 102063765 instructions in verbose mode, It's faster not using verbose mode. The -c option will enable verbose mode and tracers 100 instructions before reaching that number, so when console is spawned we have some previous context.
❯❯❯ cargo run --release -- -6 -f test/exe64win_enigma.bin -c 102063765
dll_path: maps/maps64//ntdll.dll dll: ntdll.dll
PE64 header detected.
loading memory maps
dll_path: maps/maps64//kernel32.dll dll: kernel32.dll
dll_path: maps/maps64//kernelbase.dll dll: kernelbase.dll
dll_path: maps/maps64//iphlpapi.dll dll: iphlpapi.dll
dll_path: maps/maps64//ws2_32.dll dll: ws2_32.dll
dll_path: maps/maps64//advapi32.dll dll: advapi32.dll
dll_path: maps/maps64//comctl32.dll dll: comctl32.dll
dll_path: maps/maps64//winhttp.dll dll: winhttp.dll
dll_path: maps/maps64//wininet.dll dll: wininet.dll
dll_path: maps/maps64//dnsapi.dll dll: dnsapi.dll
dll_path: maps/maps64//shell32.dll dll: shell32.dll
dll_path: maps/maps64//shlwapi.dll dll: shlwapi.dll
dll_path: maps/maps64//kernel32.dll dll: kernel32.dll
dll_path: maps/maps64//user32.dll dll: user32.dll
dll_path: maps/maps64//advapi32.dll dll: advapi32.dll
dll_path: maps/maps64//oleaut32.dll dll: oleaut32.dll
dll_path: maps/maps64//gdi32.dll dll: gdi32.dll
dll_path: maps/maps64//shell32.dll dll: shell32.dll
dll_path: maps/maps64//version.dll dll: version.dll
dll_path: maps/maps64//ole32.dll dll: ole32.dll
IAT Bound.
Delay load binding started ...
delay load bound!
entry point at 0x14072ce04
base: 0x140000000
102063740 0x14072d2ac: jne   000000014072D2A4h taken
102063741 0x14072d2a4: xor   [rax],dl
mem_trace: pos = 102063741 rip = 14072d2a4 op = read bits = 8 address = 0x14072d4cb value = 0x59 name = 'exe64win_enigma593000'
mem_trace: pos = 102063741 rip = 14072d2a4 op = write bits = 8 address = 0x14072d4cb value = 0x54 name = 'exe64win_enigma593000'
102063742 0x14072d2a6: inc   rax
102063743 0x14072d2a9: dec   rcx
102063744 0x14072d2ac: jne   000000014072D2A4h taken
102063745 0x14072d2a4: xor   [rax],dl
mem_trace: pos = 102063745 rip = 14072d2a4 op = read bits = 8 address = 0x14072d4cc value = 0x44 name = 'exe64win_enigma593000'
mem_trace: pos = 102063745 rip = 14072d2a4 op = write bits = 8 address = 0x14072d4cc value = 0x49 name = 'exe64win_enigma593000'
102063746 0x14072d2a6: inc   rax
102063747 0x14072d2a9: dec   rcx
102063748 0x14072d2ac: jne   000000014072D2A4h taken
102063749 0x14072d2a4: xor   [rax],dl
mem_trace: pos = 102063749 rip = 14072d2a4 op = read bits = 8 address = 0x14072d4cd value = 0x42 name = 'exe64win_enigma593000'
mem_trace: pos = 102063749 rip = 14072d2a4 op = write bits = 8 address = 0x14072d4cd value = 0x4f name = 'exe64win_enigma593000'
102063750 0x14072d2a6: inc   rax
102063751 0x14072d2a9: dec   rcx
102063752 0x14072d2ac: jne   000000014072D2A4h taken
102063753 0x14072d2a4: xor   [rax],dl
mem_trace: pos = 102063753 rip = 14072d2a4 op = read bits = 8 address = 0x14072d4ce value = 0x43 name = 'exe64win_enigma593000'
mem_trace: pos = 102063753 rip = 14072d2a4 op = write bits = 8 address = 0x14072d4ce value = 0x4e name = 'exe64win_enigma593000'
102063754 0x14072d2a6: inc   rax
102063755 0x14072d2a9: dec   rcx
102063756 0x14072d2ac: jne   000000014072D2A4h not taken
102063757 0x14072d2b2: jmp   000000014072D2BBh
mem_trace: pos = 102063758 rip = 14072d2bb op = read bits = 32 address = 0x14000303c value = 0x80 name = 'exe64win_enigma3000'
102063758 0x14072d2bb: mov   edi,[rsi+3Ch] ; 0x80
mem_trace: pos = 102063759 rip = 14072d2be op = read bits = 32 address = 0x140003110 value = 0x571000 name = 'exe64win_enigma3000'
102063759 0x14072d2be: mov   edi,[rdi+rsi+90h] ; 0x571000
102063760 0x14072d2c5: add   rdi,rsi
102063761 0x14072d2c8: cmp   dword ptr [rdi+0Ch],0
mem_trace: pos = 102063761 rip = 14072d2c8 op = read bits = 32 address = 0x14057400c value = 0x5722ac name = 'exe64win_enigma3000'
cmp: 0x5722ac > 0x0
102063762 0x14072d2cc: je    000000014072D370h not taken
mem_trace: pos = 102063763 rip = 14072d2d2 op = read bits = 32 address = 0x14057400c value = 0x5722ac name = 'exe64win_enigma3000'
102063763 0x14072d2d2: mov   ecx,[rdi+0Ch] ; 0x5722ac
102063764 0x14072d2d5: add   rcx,rsi
-------
102063765 0x14072d2d8: call  qword ptr [rbp+5960B4h]
--- console ---
=>
Help Command
press h to see the available commands:
=>h
--- help ---
q ...................... quit
cls .................... clear screen
h ...................... help
s ...................... stack
v ...................... vars
sv ..................... set verbose level 0, 1 or 2
r ...................... register show all
r reg .................. show reg
rc ..................... register change
f ...................... show all flags
fc ..................... clear all flags
fz ..................... toggle flag zero
fs ..................... toggle flag sign
c ...................... continue
b ...................... breakpoint list
ba ..................... breakpoint on address
bi ..................... breakpoint on instruction number
bmr .................... breakpoint on read memory
bmw .................... breakpoint on write memory
bmx .................... breakpoint on execute memory
bcmp ................... break on next cmp or test
bc ..................... clear breakpoint
n ...................... next instruction
eip .................... change eip
rip .................... change rip
push ................... push dword to the stack
pop .................... pop dword from stack
fpu .................... fpu view
md5 .................... check the md5 of a memory map
seh .................... view SEH
veh .................... view vectored execption pointer
m ...................... memory maps
ms ..................... memory filtered by keyword string
ma ..................... memory allocs
mc ..................... memory create map
mn ..................... memory name of an address
ml ..................... memory load file content to map
mr ..................... memory read, speficy ie: dword ptr [esi]
mw ..................... memory write, speficy ie: dword ptr [esi]  and then: 1af
mwb .................... memory write bytes, input spaced bytes
md ..................... memory dump
mrd .................... memory read dwords
mrq .................... memory read qwords
mds .................... memory dump string
mdw .................... memory dump wide string
mdd .................... memory dump to disk
mdda ................... memory dump all allocations to disk
mt ..................... memory test
r2 [addr] .............. spawn radare2 console if it's isntalled
ss ..................... search string
sb ..................... search bytes
sba .................... search bytes in all the maps
ssa .................... search string in all the maps
ll ..................... linked list walk
d ...................... dissasemble
dt ..................... dump structure
pos .................... print current position
enter .................. step into
tr ..................... trace reg
trc .................... trace regs clear
ldr .................... show ldr linked list
iat .................... find api name in all iat's
iatx ................... addr to api name
iatd ................... dump the iat of specific module
dump ................... dump current state to disk
---
=>
Register Commands
Use r for viewing all the registers, or r [reg] to see specific register.
=>r rsp
    rsp: 0x329f40
=>r
    rax: 0x0 0
    rbx: 0x0 0
    rcx: 0x0 0
    rdx: 0x2f 47
    rsi: 0x0 0
    rdi: 0x0 0
    rsp: 0x329f40
    rbp: 0x329ff8
    rip: 0x3c006e
    r8 : 0x0 0
    r9 : 0x0 0
    r10: 0x0 0
    r11: 0x0 0
    r12: 0x0 0
    r13: 0x0 0
    r14: 0x0 0
    r15: 0x0 0
=>rc rax
command not found, type h
=>rc
register name=>rax
value=>0x1337
=>r rax
    rax: 0x1337 4919
=>
you can use 64bits and 32bits registers only, 16/8bits is not allowed for now ("r ax" or "r al")
Maps Command
press m to list all the memory maps and addresses.
=>m
--- maps ---
oleaut32.data       0x7ff001dc7000 - 0x7ff001dca000 (12288)
ldr                 0x7ff000000000 - 0x7ff0000000b4 (180)
ntdll.pe            0x7ff000003000 - 0x7ff000004000 (4096)
kernelbase.text     0x7ff0002b6000 - 0x7ff0003c8000 (1122304)
ws2_32.didat        0x7ff00060f000 - 0x7ff000610000 (4096)
advapi32.pe         0x7ff000623000 - 0x7ff000624000 (4096)
winhttp.text        0x7ff000960000 - 0x7ff000a0f000 (716800)
iphlpapi.text       0x7ff00057f000 - 0x7ff0005a8000 (167936)
version.rsrc        0x7ff001e0c000 - 0x7ff001e0d000 (4096)
dnsapi.rdata        0x7ff000d6d000 - 0x7ff000d8f000 (139264)
kernelbase.rsrc     0x7ff000555000 - 0x7ff000556000 (4096)
comctl32.dll.ldr    0x7fe00000a000 - 0x7fe00000a940 (2368)
shell32.rsrc        0x7ff0012d8000 - 0x7ff001b1d000 (8671232)
advapi32.reloc      0x7ff0006cb000 - 0x7ff0006cd000 (8192)
advapi32.rdata      0x7ff00068a000 - 0x7ff0006bf000 (217088)
wininet.rsrc        0x7ff000cbe000 - 0x7ff000cd7000 (102400)
wininet.didat       0x7ff000cbd000 - 0x7ff000cbe000 (4096)
dnsapi.didat        0x7ff000d99000 - 0x7ff000d9a000 (4096)
ole32.pdata         0x7ff001f38000 - 0x7ff001f47000 (61440)
exe64win_enigma3000 0x140003000 - 0x140593000 (5832704)
user32.rsrc         0x7ff001c30000 - 0x7ff001d12000 (925696)
comctl32.pdata      0x7ff0008f9000 - 0x7ff00090f000 (90112)
oleaut32.text       0x7ff001d14000 - 0x7ff001da1000 (577536)
kernelbase.data     0x7ff000540000 - 0x7ff000545000 (20480)
winhttp.pdata       0x7ff000a3c000 - 0x7ff000a46000 (40960)
ws2_32.rdata        0x7ff0005fd000 - 0x7ff00060a000 (53248)
...
We can see map name, start address, end address and size in bytes.
Other memory related commands:
m ...................... memory maps
ms ..................... memory filtered by keyword string
ma ..................... memory allocs
mc ..................... memory create map
mn ..................... memory name of an address
ml ..................... memory load file content to map
mr ..................... memory read, speficy ie: dword ptr [esi]
mw ..................... memory write, speficy ie: dword ptr [esi]  and then: 1af
mwb .................... memory write bytes, input spaced bytes
md ..................... memory dump
mrd .................... memory read dwords
mrq .................... memory read qwords
mds .................... memory dump string
mdw .................... memory dump wide string
mdd .................... memory dump to disk
mdda ................... memory dump all allocations to disk
mt ..................... memory test
Get Map details from Address
if the code is using an address and you want more details, use command mn.
=>mn
address=>0x140000008
map: exe64win_enigma.pe 0x140000000-0x140001000 (4096)
=>
Note that mwemu commands dont accept parameters direcly, first type the command + enter then the parameter will prompted.
except for the r2 command that needs an address to spawn radare2, ie: r2 0x140000008
Search Commands
There are four commands to search.
-
use command ss for search a string in a specific map.
-
use command sb for search a sequence of spaced bytes in a specific map.
-
use command ssa for search a string in all the maps.
-
use command sba for search a sequence of spaced bytes in all the maps.
=>ssa  (search string in all the maps)
string=>http://something.com/
found at 0x329ec8 'http://something.com/'
found at 0x329fc8 'http://something.com/'
map not found

=>mds (display string on an address)
address=>0x329ec8
0x329ec8: 'http://something.com/'
=>mds
address=>0x329fc8
0x329fc8: 'http://something.com/'
=>

=>mn (which map is that address?)
address=>0x329ec8
map: stack 0x22a000-0x32c000 (1056768)
=>mn
address=>0x329fc8
map: stack 0x22a000-0x32c000 (1056768)
=>

=>ss (search string on specific address)
map name=>stack
string=>http://something.com/
found 0x329ec8 'http://something.com/'
found 0x329fc8 'http://something.com/'

=>sb (search spaced bytes on specific address, ie searching hexlified "http://")
map name=>stack
spaced bytes=>68 74 74 70 3a 2f 2f
found at 0x329ec8
found at 0x329fc8
=>
Breakpoint Commands
There are four types of breakpoints, but only one breakpoint can be set for each type at once.
-
break on address, the next time this address is reached the emulation will stop there.
-
break on instruction, when the emulator reach that number of instructions emulated in total, will stop there.
-
break on memory read, next time this address is readed by any assembly instruction (not api or syscall) the emulator will break there.
-
break on memory write, next write to this address (doesn't matter if is a 1-byte write or any amount) will stop the emulation.
-
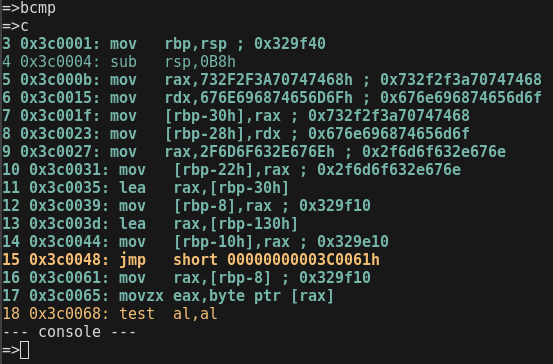
break on next cmp or test instruction, this will stop the emulator on next cmp or test instruction.
Use command "b" to see the state of the 4 types of breakpoints.There are four commands to search.
=>b
break on address: []
break on instruction: []
break on memory read: []
break on memory write: []
Use these commands to set the breakpoints:
b ...................... breakpoint list
ba ..................... breakpoint on address
bi ..................... breakpoint on instruction number
bmr .................... breakpoint on read memory
bmw .................... breakpoint on write memory
bmx .................... breakpoint on execute memory
bcmp ................... break on next cmp or test instruction
bc ..................... clear breakpoint
Some examples:
--- console ---
=>bi
instruction number=>100
=>c
18 0x3c006a: jne   short 00000000003C004Ah taken
19 0x3c004a: mov   rax,[rbp-8] ; 0x329f10
20 0x3c004e: movzx edx,byte ptr [rax]
21 0x3c0051: mov   rax,[rbp-10h] ; 0x329e10
22 0x3c0055: mov   [rax],dl ; 0x68
23 0x3c0057: add   qword ptr [rbp-8],1
24 0x3c005c: add   qword ptr [rbp-10h],1
25 0x3c0061: mov   rax,[rbp-8] ; 0x329f11
...
96 0x3c0065: movzx eax,byte ptr [rax]
97 0x3c0068: test  al,al
98 0x3c006a: jne   short 00000000003C004Ah taken
99 0x3c004a: mov   rax,[rbp-8] ; 0x329f18
-------
100 0x3c004e: movzx edx,byte ptr [rax]   (this instruction is the next to be emulated, it was not emulated yet)
--- console ---
=>
Change Verbosity
If you type the "sv" command, mwemu will ask you for the new verbosity level number, these are the possible verbose levels:
-
0: It's like not using any -v for minimum verbosity, only WinAPI calls and syscalls will be printed.
-
1: It's like using -v for viewing also some messages like, polymorfic code detected etc.
-
2: It's like using -vv for viewing also the assembly code, mwemu will print every assembly instruction, this makes slower the emulation.2: Use -vv for viewing also the assembly code, mwemu will print every assembly instruction, this makes slower the emulation.
-
3: It's like using -vvv for also viewing every "rep" interaction, in instruction with rep prefix like "rep movzx" will print one line for every step of the rep loop.
For instance, we want to emulate quiclky the first 200 insturctions, and then enable the verbosity, this could be dont with -V, but let's do it from the console with "sv" command:
~/s/mwemu ❯❯❯ cargo run --release -- -6 -f test/sc64win_strgen.bin -c 200
...
200 0x3c004e: movzx edx,byte ptr [rax]    (instruction 200 is not emulated yet, it's the next instruction to be emulated)
--- console ---
=>sv
verbose level=>3
=> [enter for emulating instruction 200]
=> c  (continue emulating now with maximum verbosity)
...
View LDR
The LDR is a triple circular liked list that cointains all the linked modules (not only DLL, also EXE)
MWEMU provides several commands to view and query the LDR.
-
"ldr" command is the way of viewing the LDR contents.
-
"iat" comamnd allows to find an specified api name in all the IAT's of every linked module.
-
"iatx" If we have an address and we want to know which API name is, this command does the address to name query.
-
"iatd" command dump the full IAT of a specified module.
--- console ---
=>ldr
0x7fe000000000 loader.exe flink:7fe000004000 blink:7fe00000f000 base:7ff001b7e000 pe_hdr:f8 5045
0x7fe000004000 ntdll.dll flink:7fe000005000 blink:7fe000000000 base:7ff000003000 pe_hdr:e8 5045
0x7fe000005000 kernel32.dll flink:7fe000006000 blink:7fe000004000 base:7ff0001f8000 pe_hdr:f0 5045
0x7fe000006000 kernelbase.dll flink:7fe000007000 blink:7fe000005000 base:7ff0002b5000 pe_hdr:f0 5045
0x7fe000007000 iphlpapi.dll flink:7fe000008000 blink:7fe000006000 base:7ff00057e000 pe_hdr:f8 5045
0x7fe000008000 ws2_32.dll flink:7fe000009000 blink:7fe000007000 base:7ff0005b8000 pe_hdr:f0 5045
0x7fe000009000 advapi32.dll flink:7fe00000a000 blink:7fe000008000 base:7ff000623000 pe_hdr:100 5045
0x7fe00000a000 comctl32.dll flink:7fe00000b000 blink:7fe000009000 base:7ff0006cd000 pe_hdr:f0 5045
0x7fe00000b000 winhttp.dll flink:7fe00000c000 blink:7fe00000a000 base:7ff00095f000 pe_hdr:f8 5045
0x7fe00000c000 wininet.dll flink:7fe00000d000 blink:7fe00000b000 base:7ff000a4f000 pe_hdr:f0 5045
0x7fe00000d000 dnsapi.dll flink:7fe00000e000 blink:7fe00000c000 base:7ff000cd9000 pe_hdr:f8 5045
0x7fe00000e000 shell32.dll flink:7fe00000f000 blink:7fe00000d000 base:7ff000da4000 pe_hdr:f0 5045
0x7fe00000f000 shlwapi.dll flink:7fe000000000 blink:7fe00000e000 base:7ff001b2c000 pe_hdr:f0 5045
View Structures
The windows debugger windbg has a unique feature that is dt command to see information about structures, is quite useful and uniq.
MWEMU implements a similar dt command but for specific structures, that could be useful in some situations.
Let's use dt to inspect PEB structure.
=>dt
structure=>peb
address=>0x7ffdf000
PEB {
    reserved1: [
        0x0,
        0x0,
    ],
    being_debugged: 0x0,
    reserved2: 0x0,
    reserved3: [
        0xffffffff,
        0x400000,
    ],
    ldr: 0x77647880,
    process_parameters: 0x2c1118,
    reserved4: [
        0x0,
        0x2c0000,
        0x77647380,
    ],
    alt_thunk_list_ptr: 0x0,
    reserved5: 0x0,
    reserved6: 0x6,
    reserved7: 0x773cd568,
    reserved8: 0x0,
    alt_thunk_list_ptr_32: 0x0,
    reserved9: [
        0x0,
...
Let's use dt to inspect PEB_LDR_DATA structure.
=>dt
structure=>PEB_LDR_DATA
address=>0x77647880
PebLdrData {
    length: 0x30,
    initializated: 0x1,
    sshandle: 0x0,
    in_load_order_module_list: ListEntry {
        flink: 0x2c18b8,
        blink: 0x2cff48,
    },
    in_memory_order_module_list: ListEntry {
        flink: 0x2c18c0,
        blink: 0x2cff50,
    },
    in_initialization_order_module_list: ListEntry {
        flink: 0x2c1958,
        blink: 0x2d00d0,
    },
    entry_in_progress: ListEntry {
        flink: 0x0,
        blink: 0x0,
    },
}
=>
Let's use dt to inspect LDR_DATA_TABLE_ENTRY structure, that represents one LDR entry in the linked list of a specific linked module.
=>dt
structure=>LDR_DATA_TABLE_ENTRY
address=>0x2c18c0
LdrDataTableEntry {
    reserved1: [
        0x2c1950,
        0x77647894,
    ],
    in_memory_order_module_links: ListEntry {
        flink: 0x0,
        blink: 0x0,
    },
    reserved2: [
        0x0,
        0x400000,
    ],
    dll_base: 0x4014e0,
    entry_point: 0x1d000,
    reserved3: 0x40003e,
    full_dll_name: 0x2c1716,
    reserved4: [
        0x0,
        0x0,
        0x0,
        0x0,
        0x0,
        0x0,
        0x0,
        0x0,
    ],
    reserved5: [
        0x17440012,
        0x4000002c,
        0xffff0000,
    ],
    checksum: 0x1d6cffff,
    reserved6: 0xa640002c,
    time_date_stamp: 0xcdf27764,
}
=>
Example: a malware is hiding something in an exception.
3307726 0x4f9673: push  ebp
3307727 0x4f9674: push  edx
3307728 0x4f9675: push  eax
3307729 0x4f9676: push  ecx
3307730 0x4f9677: push  ecx
3307731 0x4f9678: push  4F96F4h
3307732 0x4f967d: push  dword ptr fs:[0]
Reading SEH 0x0
-------
3307733 0x4f9684: mov   eax,[51068Ch]
--- console ---
=>
Let's inspect exception structures:
--- console ---
=>r esp
        esp: 0x22de98
=>dt
structure=>cppeh_record
address=>0x22de98
CppEhRecord {
    old_esp: 0x0,
    exc_ptr: 0x4f96f4,
    next: 0xfffffffe,
    exception_handler: 0xfffffffe,
    scope_table: PScopeTableEntry {
        enclosing_level: 0x278,
        filter_func: 0x51068c,
        handler_func: 0x288,
    },
    try_level: 0x288,
}
=>
And here we have the error routine 0x4f96f4 and the filter 0x51068c.
View Data
There are multiple commands to view data, but currently I'm using the "r2 addr" command which is better bot for code and data. Note that r2 command executes the radare2 and transfer the memory map of the selected address, and sync radare2 with mwemu, but this command needs to have installed radare2 in the path, for instance from the git. More details on radare2 chapter. It worth to install radare2.
Commands for displaying information:
mr ..................... memory read, speficy ie: dword ptr [esi]
mw ..................... memory write, speficy ie: dword ptr [esi]  and then: 1af
mwb .................... memory write bytes, input spaced bytes
md ..................... memory dump
mrd .................... memory read dwords
mrq .................... memory read qwords
mds .................... memory dump string
mdw .................... memory dump wide string
mdd .................... memory dump to disk
mdda ................... memory dump all allocations to disk
mt ..................... memory test
Example with md command:
--- console ---
=>md
address=>0x329ec8
0x329ec8: 68 74 74 70 3a 2f 2f 73 6f 6d 65 74 68 69 6e 67     http://something
0x329ed8: 2e 63 6f 6d 2f 00 00 00 00 00 00 00 00 00 00 00     .com/...........
0x329ee8: 00 00 00 00 00 00 00 00 00 00 00 00 00 00 00 00     ................
0x329ef8: 00 00 00 00 00 00 00 00 00 00 00 00 00 00 00 00     ................
0x329f08: 00 00 00 00 00 00 00 00 00 00 00 00 00 00 00 00     ................
0x329f18: 00 00 00 00 00 00 00 00 00 00 00 00 00 00 00 00     ................
0x329f28: 00 00 00 00 00 00 00 00 00 00 00 00 00 00 00 00     ................
0x329f38: 00 00 00 00 00 00 00 00 00 00 00 00 00 00 00 00     ................
=>
Radare2 Command
This command gives a lot of power to MWEMU because we can use radare2 from inside of a MWEMU emualtion moment.
Note that this executes another program (also free software) named radare2 that has to be installed and accesible from the path.

The instalation is simple I will explan it later.
Spawning radare over a data address:
Using q to return form r2 prompt to mwemu prompt and spawn radare again with a code address:
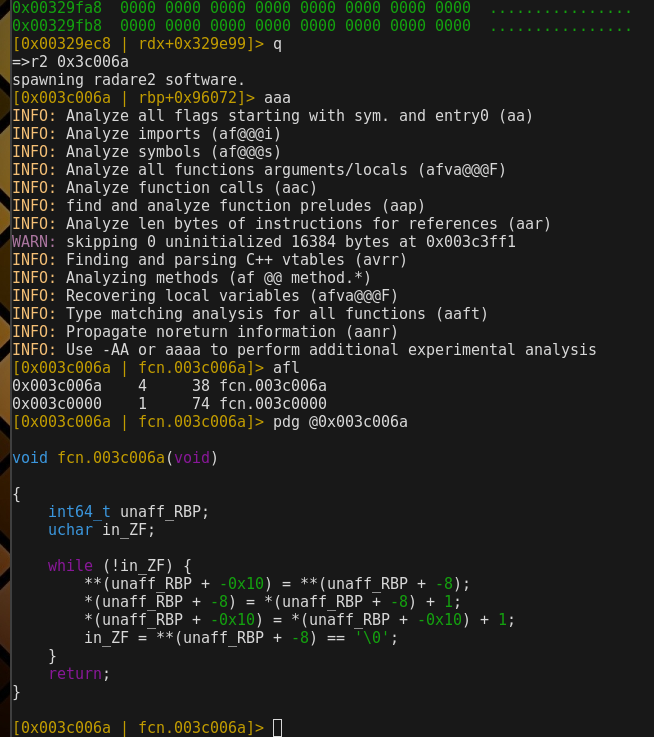
Radare are recognizing functions and decompiling them with the multiple decompilers, even we can use decai for AI based decompiled in python etc.
More info specific of radare commands check the r2book: https://book.rada.re/
Regarding the radare2 installation:
❯❯❯ git clone https://github.com/radareorg/radare2.git
❯❯❯ cd radare2
❯❯❯ sys/install.sh
The install.sh script does all the installation, It will prompt sudo to copy binaries to folders that are on the path.
If radare2 is in the path, It would be possible to trigger it from mwemu r2 command.
MWEMU from python scripts
This is probably the most practical use-case of MWEMU, using the pymwemu python module.
pymwemu Instalation
They easiest way to install this is using pip, the package is published at pypi https://pypi.org/project/pymwemu/
For using latest version use git, but it's more tricky to install, because you need rust, cargo and maturin.
It's precompiled for linux 64bits, so in linux in theory you don't need to install rust first.
In linux you just do:
❯❯❯ pip3 install pymwemu --break-system-packages
In mac, windows or if the pip requires it, install first rust.
Install rust from rustup, make sure cargo is on the path, and do pip or pip3:
❯❯❯ pip install --upgrade pip
❯❯❯ pip3 install --upgrade pip
❯❯❯ curl --proto '=https' --tlsv1.2 -sSf https://sh.rustup.rs | sh
❯❯❯ pip install pymwemu
❯❯❯ pip3 install pymwemu
In mac, if there is a problem with !tapi-tbd the solution is:
❯❯❯ sudo xcode-select --switch /Library/Developer/CommandLineTools
If there is the error: Caused by: feature `edition2024` is required. then update your rust: rustup update
To verify the installation we can import the module in python console.
❯❯❯ python3
Python 3.13.5 (main, Jun 25 2025, 18:55:22) [GCC 14.2.0] on linux
Type "help", "copyright", "credits" or "license" for more information.
>>> import pymwemu
Initialized logging
>>> emu = pymwemu.init64()
>>> emu.version()
            '0.10.5'
build pymwemu (only for developers)
sudo apt install python3.13-venv
python3 -m venv .venv
source .venv/bin/activate.fish
pip install -U pip maturin
maturin develop --release
python
import pymwemu
Initialized logging  # loaded ok
^D
MATURIN_PYPI_TOKEN="..." maturin publish
remember to update version both in Crates.toml and pyproject.toml
Create the emulation object
First of all, import the module and init the 32bits or the 64bits engine.
>>> import pymwemu
Initialized logging
>>> emu = pymwemu.init32()
            or
>>> emu = pymwemu.init64()
Configure the Emulator
Then there are some initial configurations you can do.
>>> emu.set_verbose(3)     # to show all the assembly, normally this is not needed. By default is 0 verbose.
>>> emu.enable_console()   # by default is disabled.
>>> emu.spawn_console_at_pos(6) # useful for debugging the script.
loading memory maps
>>>
>>>
All the configurations available:
set_verbose(n: int)0: only display apicalls, 1: also messages, 2: also assembly, 3: also unrolled reps.enable_console()this spawns mwemu command console.disable_console()spawn_console_at_pos(n: int)spawn the console when position n will be reached (n instructions emulated)spawn_console_at_addr(addr: int)spawn the console when addr is reached.disable_colors()enable_colors()enable_trace_mem()disable_trace_mem()enable_trace_regs()disable_trace_regs()enable_trace_reg(regs_list: list(str))provide list of strings with name of registers to be traced.disable_trace_reg()update_ldr_entry_base(libname: str, base: int)set_stack_base(addr: int)enable_count_loops()disable_count_loops()enable_trace_string(addr: int)disable_trace_string()enable_inspect_sequence(seq: str)disable_inspect_sequence()enable_endpoint_mode()disable_endpoint_mode()set_entry_point(addr: int)set_base_address(addr: int)enable_stack_trace()disable_stack_trace()enable_test_mode()disable_test_mode()enable_banzai_mode()disable_banzai_mode()banzai_add(apiname: str, nparams: int)banzai keep emulating on a non implemented API.enable_ctrlc()disable_ctrlc()
Loading Maps
In most of cases you will need to load all the Windows OS simulation part, to have all the PEB+TEB+LDR linkedlist and WinAPI infra.
For doing this you can use emu.load_maps(folder:str)
If you are going to emulate pure assembly, with no api calls, and no access to windows structures, you don't need to load the maps.
So does if you are emulating linux elf64 or shellcodes (remember, elf64 is not well suported for now)
Example:
>>> emu.load_maps('/home/sha0/src/mwemu/maps/maps64/')
loading memory maps
dll_path: /home/sha0/src/mwemu/maps/maps64//ntdll.dll dll: ntdll.dll
dll_path: /home/sha0/src/mwemu/maps/maps64//kernel32.dll dll: kernel32.dll
dll_path: /home/sha0/src/mwemu/maps/maps64//kernelbase.dll dll: kernelbase.dll
dll_path: /home/sha0/src/mwemu/maps/maps64//iphlpapi.dll dll: iphlpapi.dll
dll_path: /home/sha0/src/mwemu/maps/maps64//ws2_32.dll dll: ws2_32.dll
dll_path: /home/sha0/src/mwemu/maps/maps64//advapi32.dll dll: advapi32.dll
dll_path: /home/sha0/src/mwemu/maps/maps64//comctl32.dll dll: comctl32.dll
dll_path: /home/sha0/src/mwemu/maps/maps64//winhttp.dll dll: winhttp.dll
dll_path: /home/sha0/src/mwemu/maps/maps64//wininet.dll dll: wininet.dll
dll_path: /home/sha0/src/mwemu/maps/maps64//dnsapi.dll dll: dnsapi.dll
dll_path: /home/sha0/src/mwemu/maps/maps64//shell32.dll dll: shell32.dll
dll_path: /home/sha0/src/mwemu/maps/maps64//shlwapi.dll dll: shlwapi.dll
>>>
Note that this need to have the maps, so git clone the repo:
❯❯❯ git clone https://github.com/sha0coder/mwemu.git
loading ELF, PE, or shellcodes
-
emu.load_binary(filename:str)load the sample to be emulated. -
emu.load_code_bytes(opcodes:bytes)if you have the bytes already on python bytes() / bytearray()
Example:
>>> emu.load_binary('shellcodes32/shikata.bin')
>>>
It detects if it's ELF, PE and otherwise is a shellcode.
In the case of PE or shellcode the win32 simulation is initialized automatically.
In the case of ELF the linux64 simulation is initialized automatically.
But if for any reason you don't use load_binary() and you need the windows simulator with peb/ldr/dlls loaded on the memory, you need to call init_win32 (even for 64bits, it will detect the arch)
And if you dont use load_binary() but you need the linux simulator with libc etc loaded, use init_linux64. Note that linux implementation is very basic and only for static 64bits
Note that calling init_win32() requires previously to have done load_maps to set the maps folder.
>>> emu.init_win32()
            or
>>> emu.init_linux64(is_dynamic)
Creating Buffers
You can load sections from disk to the emulator's virtual memory, and also can allocate buffers.
alloc(name: str, size: int) -> intsimplest way to alloc a buffer, it returns the address.alloc_at(name: str, addr: int, size: int)the name is an unique id of the allocated map.load_map(name: str, filename: str, base_addr: int)load extra payloads from disk, sections dumped etc.link_library(filepath: str) -> intlink a custom dll in the LDR.free(name: str)free an allocation.
Examples:
>>> addr = emu.alloc("mybuffer", 1024)
>>> emu.alloc_at("mybuffer", 0x1000, 1024)
>>> emu.load_map("mybuffer", "something.dll", 0x1000)
Registers
You can view the register values and modify it in any moment.
For instance to prepare the context previous to the emulation, preparing an emulation state.
get_reg(reg: str) -> intprovide the name of the register to view it.set_reg(reg: str, value: int) -> intmodify a register.get_xmm(reg: str) -> u128also can view xmm registers.set_xmm(reg: str, value: u128) -> u128and can modify xmm registers.
for changing rip triggering all flow change logic ie winapi calls etc.set_rip(addr: int) -> bool
for changing eip triggering all flow change logic ie winapi calls etc.set_eip(addr: int) -> bool
Examples:
>>> rax = emu.get_reg('rax')
>>> emu.set_reg('rax', rax+1)
Memory operations
It could be useful for pinpoint the emulation state before starting the emulation, but other option is checking the memory after the emulation or altering it during the emulation.
Note that this read/write are inside the emulation virtual memory.
write_qword(addr: int, value: int) -> boolwrite_dword(addr: int, value: int) -> boolwrite_word(addr: int, value: u16) -> boolwrite_byte(addr: int, value: u8) -> boolwrite_bytes(to: int, from: bytes)write_string(to: int, from: str)write_wide_string(to: int, from: str)write_buffer(to: int, from: bytes)write_spaced_bytes(addr: int, spaced_hex_bytes: str) -> boolread_128bits_be(addr: int) -> u128read_128bits_le(addr: int) -> u128read_qword(addr: int) -> intread_dword(addr: int) -> intread_word(addr: int) -> u16read_byte(addr: int) -> u8read_buffer(from: int, sz: int) -> Vecread_bytes(addr: int, sz: int) -> bytesread_string_of_bytes(addr: int, sz: int) -> strread_string(addr: int) -> strread_wide_string(addr: int) -> strmemset(addr: int, byte: int, amount: int)memcmp(to_addr: int, from_addr: int, amount: int)sizeof_wide(unicode_str_ptr: int) -> intsearch_spaced_bytes_from(saddr: int, sbs: str) -> intsearch_spaced_bytes_from_bw(saddr: int, sbs: str) -> intsearch_spaced_bytes(sbs: str, map_name: str) -> Vecsearch_spaced_bytes_in_all(sbs: str) -> Vecsearch_string(kw: str, map_name: str) -> list[int]search a string in a specific map.search_string_in_all(kw: str)search a string in all the memory maps, not very useful becaouse dont return the result, just print it. It will be improved.search_bytes(bkw: bytes, map_name: str) -> list[int]search bytes in a specific memory map, the result is a list of addresses.
memory write
read operations
libc style memory operations:
search methods:
Examples of preparing context previous to start emulation:
>>> some_data_structure_needed = open('blob.bin','rw').read()
>>> addr = emu.alloc("struct1", len(some_data_structure_needed))
>>> emu.write_bytes(addr, some_data_structure_needed)
>>> emu.set_reg('rdi', addr)
>>> rax = emu.call32(0x40323, [addr, 0])
Another example:
import pymwemu

emu = pymwemu.init64()
buffer_addr = emu.alloc("mybuffer", 1024)

# Write a string
emu.write_string(buffer_addr, "Hello MWEMU!")

# Read it back
text = emu.read_string(buffer_addr, 12)
print(f"Read: {text}")

# Write dword
emu.write_dword(buffer_addr + 0x100, 0x12345678)
value = emu.read_dword(buffer_addr + 0x100)
print(f"DWORD: {hex(value)}")

# Write raw bytes
data = b"\x90\x90\x90\xc3"  # nop nop nop ret
emu.write_buffer(buffer_addr + 0x200, data)
Start Emulation
Once everything is configured, you can start the emulation.
run(end_addr) -> intprovide the address to end the emulation or None to emulate as further as possible.run_to(position: int) -> intemulate a specific number of instructions.call32(address: int, params: list[int]) -> intcall a funcion using microsoft 32bits calling convention.call64(address: int, params: list[int]) -> intcall a functon using microsoft 64bits calling convention.linux_call64(address: int, params: list[int]) -> intcall a function using linux 64bits calling convention.stop()stop emulation, i never used this call.run_until_return() -> intrun_until_apicall() -> (int, str)step() -> boolyou can use a while step(): loop and control the situation step by step. This is slow.handle_winapi(addr: int)
import pymwemu

emu = pymwemu.init64()
emu.load_binary('shellcode.bin')

rip = emu.run(None)

print("Emulation finished")
print(f"Final RAX: {hex(emu.get_rax())}")
print(f"Instructions executed: {emu.get_pos()}")
Calling Functions Directly
You can call functions at specific addresses with call32/call64:
import pymwemu

# Example: call a decryption function
emu = pymwemu.init64()
emu.load_maps('/path/to/maps/maps64/')
emu.load_binary('malware.exe')

# Allocate buffer for output
output_buffer = emu.alloc("output", 1024)

# Call function at 0x401234 with arguments
# Function signature: decrypt(char* input, char* output, int size)
encrypted_str = 0x404000  # address of encrypted data
result = emu.call64(0x401234, [encrypted_str, output_buffer, 100])

# Read decrypted result
decrypted = emu.read_string(output_buffer, 100)
print(f"Decrypted: {decrypted}")
print(f"Return value: {hex(result)}")
import pymwemu

# Example with 32-bit malware
emu = pymwemu.init32()
emu.load_binary('malware32.exe')

# Call a string decryption routine
# Function: char* decrypt_string(int index)
decrypt_func = 0x00401200

for i in range(10):
    # Call function with index
    result_addr = emu.call32(decrypt_func, [i])

    # Read decrypted string
    if result_addr != 0:
        decrypted = emu.read_string(result_addr, 256)
        print(f"String {i}: {decrypted}")
Step-by-Step Emulation
For debugging or detailed control, execute instruction by instruction:
import pymwemu

emu = pymwemu.init64()
emu.set_verbose(2)  # show assembly
emu.load_binary('shellcode.bin')

# Execute 10 instructions one by one
for i in range(10):
    emu.step()
    rip = emu.get_rip()
    rax = emu.get_rax()
    print(f"Step {i+1}: RIP={hex(rip)} RAX={hex(rax)}")

print(f"Total instructions: {emu.get_pos()}")
Additional Useful Methods
Other helpful methods for emulation control:
-
emu.get_pos() -> intget current instruction position -
emu.set_verbose(level:int)set verbosity (0=quiet, 1=API, 2=asm, 3=all) -
emu.spawn_console()spawn interactive console -
emu.print_maps()print the full list of maps. -
emu.print_maps_by_keyword(kw: str)print the maps that match with that keyword. -
emu.search_bytes(pattern:bytes) -> listsearch for byte pattern in memory.
>>> # Run and then spawn console for inspection
>>> emu.run(1000)
>>> emu.spawn_console()  # interactive debugging
>>>
>>>
>>> # Search for strings
>>> addresses = emu.search_bytes(b"http://")
>>> for addr in addresses:
...     print(f"Found at: {hex(addr)}")
>>>
Practical Example: String Decryption
A typical use case is decrypting malware strings:
#!/usr/bin/env python3
import pymwemu

# Initialize
emu = pymwemu.init32()  # 32-bit malware
emu.load_binary('malware32.exe')

# Find encrypted strings in .data section
encrypted_strings = [
    0x00401000,
    0x00401100,
    0x00401200,
]

# Decrypt function address (from IDA/Ghidra)
decrypt_func = 0x00402340

decrypted = []

for enc_addr in encrypted_strings:
    # Set parameters
    emu.set_eax(enc_addr)  # pointer to encrypted string
    emu.set_eip(decrypt_func)  # start at decrypt function

    # Run until return
    emu.run(10000)

    # Read decrypted result (assume in EAX)
    result_addr = emu.get_eax()
    decrypted_str = emu.read_string(result_addr, 256)

    print(f"Encrypted {hex(enc_addr)} -> {decrypted_str}")
    decrypted.append(decrypted_str)

# Save results
with open('decrypted_strings.txt', 'w') as f:
    for s in decrypted:
        f.write(s + '\n')
Stack operations
There are methods for altering the stack, note that you also could do emu.write_qword(emu.get_reg('rsp'), 123)
But with this meethods you trigger all the stack logic, also incrementing rsp/esp.
stack_push32(value: int) -> boolstack_push64(value: int) -> boolstack_pop32() -> intstack_pop64() -> int
This example simulates a stack based calling convention, but note that you can also use call32() and call64() and linux_call64() methods.
>>> emu.stack_push32(ret_addr)
>>> emu.stack_push32(param1)
>>> emu.stack_push32(param2)
>>> emu.set_reg('rip', 0x40123)
>>> emu.run(None)
Breakpoints
mwemu's breakpoitns are simple, and most of times there are better ways to trigger the emulation to stop.
You can bp an adderss (only one at time ...) or instruction, also memory read/write
bp_show()bp_clear_all()bp_set_addr(addr: int)bp_get_addr() -> Vecbp_set_inst(ins: int)bp_get_inst() -> Vecbp_set_mem_read(addr: int)bp_get_mem_read() -> Vecbp_set_mem_write(addr: int)bp_get_mem_write() -> Vec
Example
>>> emu.set_bp_addr(0x11223344)
>>> emu.run(None)
Memory dump
there are several ways do do a memory dump
save_all_allocs(path: str)only save to disk allocations done by the emulated code.save(addr: int, size: int, filename: str)dump specific blob to disk.
Example
>>> emu.print_maps()
...
>>> emu.save(0x40324234, 1024, "/tmp/blob.bin")
View info
There are some less used methods to fetch different type of information.
get current pymwemu version.version() -> strget_prev_mnemonic() -> strget last emulated mnemonic.reset_pos()reset the emulated instruction count to zero.is_64bits() -> booldetect in which mode is the emulator.is_32bits() -> booldetect in which mode is the emulator.get_position() -> intget current pos, (amount of emulated instructions).disassemble(addr: int, amount: int) -> strdissassemble bytes.print_maps()print all the maps (allocs, linked dlls, etc)print_maps_by_keyword(kw: str)print the maps that contain a keyword.get_addr_base(addr: int) -> intget the begining of a map.is_mapped(addr: int) -> boolcheck if an address is allocated.get_addr_name(addr: int) -> strget in which map name is the address.dump(addr: int)print bytes.dump_n(addr: int, amount: int)print n bytes.dump_qwords(addr: int, n: int)print a list of qwords.dump_dwords(addr: int, n: int)print a list of dwords.allocated_size() -> intshow the total allocated memory.memory_overlaps(addr: int, sz: int) -> boolcheck if a memory block overlaps with existing map.show_allocs()print all the allocations.mem_test() -> booldo a automatic memory test to look for map overlapps.api_addr_to_name(addr: int) -> strprovide an address pointing to an API and will fetch the API name.api_name_to_addr(name: str) -> intget the address of an api name.
Example
>>> name = api_addr_to_name(0x11223344)
>>> print( name )
        MessageBoxA
Change architecture bits.
There are methods for changing from 32bits to 64bits and vice versa.
set_64bits()set_32bits()inspect_seq(s: str)
But better don't change the architecture on the fly, re-instantiate the emulation object like:
Example
>>> import pymwemu
>>> emu = pymwemu.init32()
>>> ...
>>> emu = pymwemu.init64()
Real case examples.
Find some examples here:
https://github.com/sha0coder/mwemu/tree/main/crates/pymwemu/examples/scripts
And some jupyter nobebooks here:
https://github.com/sha0coder/mwemu/tree/main/crates/pymwemu/examples
MWEMU for Rust apps
Core and bindings are everything implemented in Rust, and all the logic is inside libmwemu, so a rust program can have even more control of the emulator than pymwemu.
So having said that, from Rust you can use all the power of MWEMU, and access to most of the objects because are public most of them, so you can have a good control of the emulator.
Start a project
First of all you need the rustc compiler and the cargo tool, best way of installing this is rustup.rs
❯❯❯ curl --proto '=https' --tlsv1.2 -sSf https://sh.rustup.rs | sh
Then you have to create a rust project.
  ❯❯❯ cargo init --bin myproject
  ❯❯❯ cd myproject
This creates a folder with src/main.rs and also Cargo.toml
Add de dependency to Cargo.toml manually or better automatically using cargo too.
❯❯❯ cargo add libmwemu

❯❯❯ cat Cargo.toml
[package]
name = "myproject"
version = "0.1.0"
edition = "2024"

[dependencies]
libmwemu = "0.23.5"
Then you can add code to src/main.rs
build project
If you need to run the project remember to use the release mode (adding --release)
In release mode the emulator is blazing fast.
❯❯❯ cargo run --release
The compilation will be slower the first time because have to download the libmwemu and compile it automaticall.
What cargo run does internally is compiling like (cargo build --release) and then execute the binary.
You can pass parameter to cargo and also to your code in this way:
cargo run [cargo args] -- [you program args] example:
❯❯❯ cargo run --release -- samples/binary.exe
Create the emulation object
First of all, use the emu32 or emu64 object depending what you need.
If you will do memory allocations you al will need to use the Permission object.
use libmwemu::emu32;
use libmwemu::maps::mem64::Permission;
Note that even in 32bits the Permission object implementation is implemented in mem64, actually internally all is 64bits
Then create the emulation object for the chosen architecture.
let mut emu = emu32(); // or also emu64()
Configure the Emulator
Then optionally you can use modificators to configure the emulator, even access directly to Config object
All the configurations available:
emu.set_verbose(n: u32)change verbosity, 0: only show winapi calls, 1: also messages, 2: also every asm instructions, 3: also every rep iteration.emu.set_stack_address(addr: u64)emu.set_base_address(addr: u64)set the base address of the code, the initial emulable blob, by default mwemu gets it from the PE/ELF structures.emu.disable_ctrlc()emu.disable_console()emu.disable_banzai()emu.disable_color()emu.disable_interrupt()emu.disable_exception()emu.disable_memory_read()emu.disable_memory_write()emu.disable_pre_instruction()emu.disable_post_instruction()emu.disable_winapi_call()emu.spawn_console()emu.spawn_console_at(exp: u64)emu.spawn_console_at_addr(addr: u64)emu.update_ldr_entry_base(libname: &str, base: u64)
From rust you can also modify directly the Config structure, example:
            emu.cfg.arguments = "--exe_sample_some_arg".to_string();
            emu.cfg.shellcode = true;
Find here all the configs available inConfig object.
But main configs has function wrappers in the main Emu base object.
You can also create a Config object and set it to the emulator with emu.set_config(cfg: Config) but normaly is more convinien to access to emul.cfg as seen above.
Configuring Maps Folder
In most of cases you will need to load all the Windows OS simulation part, to have all the PEB+TEB+LDR linked-list doing windows Process Simulation.
For doing this you can use emu.set_maps_folder(folder:str)
If you are going to emulate pure assembly, with no api calls, and no access to windows structures, you don't need to load the maps.
Example:
let mut emu = emu64();
emu.set_maps_folder("/home/sha0/src/mwemu/maps/maps64/");
emu.init_logger();
Note that this need to have the maps, so git clone the repo:
❯❯❯ git clone https://github.com/sha0coder/mwemu.git
This call configure the path, but don't load it for now!
Later we will use one of those 3 to trigger the win32 simulator:
emu.load_code(file: &str)if it's PE or shellcode will call internally init_win32emu.init_win32(clear_registers: bool, clear_flags: bool)you can trigger directly the win32 simulation, but don't call it twice.
So, if you need the maps and win32 stuff but you don't do load_sample, then you will need to call directly the init_win32
loading ELF, PE, or shellcodes
In most of cases you will need to load a sample, from file or from vector.
Load your main sample with one of these methods, and only once.
For loading aditional maps, use the load/allocation methods that are explained later.
-
emu.load_code(filename: &str)load the sample to be emulated. -
emu.load_code_bytes(opcodes: &[u8])if you have the bytes already on a variable.
Example1:
emu.load_code("/samples/sample.bin");
Example2:
let mut opcodes: Vec<u8> = Vec::new();
... // fill the opcodes
let mut emu = emu32();
emu.set_maps_folder("/home/sha0/src/mwemu/maps/maps64/");
emu.load_code_bytes(&opcodes);
emu.init_win32(false, false);
Example3:
let mut emu = emu32();
emu.load_code_bytes(&opcodes);
emu.init_linux64();  // load_code("sample") would trigger init_win32 or init_linux64 depending on file format.
                     // but with no load_code we must trigger manually the init if we need it.
It detects if it's ELF, PE and otherwise is a shellcode.
In the case of PE or shellcode the win32 simulation is initialized automatically.
In the case of ELF the linux64 simulation is initialized automatically.
But if for any reason you don't use load_code() and you need the windows simulator with peb/ldr/dlls loaded on the memory, you need to call init_win32 (even for 64bits, it will detect the arch)
And if you dont use load_binary() but you need the linux simulator with libc etc loaded, use init_linux64. Note that linux implementation is very basic and only for static 64bits
Note that calling init_win32() requires previously to have done load_maps to set the maps folder.
Creating Buffers
You can load sections from disk to the emulator's virtual memory, and also can allocate buffers.
emu.alloc(map_name: &str, size: u64, permission: Permission) -> u64simplest way to alloc a buffer, it returns the address.emu.maps.alloc(sz: u64) -> Option<u64>this is used by the winapi and linux syscalls, this just find a free block of size sz, but don't allocate it, you need then to do emu.maps.create_map
create an empty map at specific location.emu.maps.create_map(name: &str, base: u64, size: u64, permission: Permissionemu.free(map_name: &str);deallocate by map name.emu.maps.dealloc(addr: u64);deallocate by address.emu.link_library(filepath: &smp;str) -> u64dynamic link a custom dll to the LDR struct.
Example1:
use libmwemu::maps::mem64::Permission;
use libmwemu::emu32;
...
let ptr_encoded = emu.alloc("enc", 1024, Permission::READ_WRITE_EXECUTE);
let ptr_decoded = emu.alloc("dec", 1024, Permission::READ_WRITE_EXECUTE);
emu.maps.write_bytes(ptr_encoded, &data);
let rax = emu.call64(decoder_func_addr, &[ptr_encoded, ptr_decoded]);
Example2:
let addr = emu.maps.alloc(1024);
let map = emu
            .maps
            .create_map("section_memorydump", addr, 1024, Permission::READ_WRITE_EXECUTE)
            .expect("load_map out of memory");
map.load("dumped_section.bin");
map is a Mem64 object, and it has multiple methods. But for most of cases emu and emu.maps methods are enoguth.
Registers
You can view the register values and modify it in any moment.
For instance to prepare the context previous to the emulation, preparing an emulation state.
Reading a 64bits register or bigger is very direct
let rax = emu.regs().rax;
let rip = emu.regs().rip;
let xmm15 = emu.regs().xmm15;
Settings a 64bits register or bigger is very direct.
emu.regs_mut().rax = 0x123;
emu.regs_mut().rip = 0x4012312;
emu.regs_mut().xmm15 = 0x11223344_11223344_11223344_11223344u128;
Getters for non 64bits (it return always u64 type)
let eax = emu.regs().get_eax() as u32;
let eip = emu.regs().get_eip() as u32;
let al = emu.regs().get_eip() as u8;
Setters for non 64bits (provide always u64 type)
emu.regs_mut().set_eax(123u8);
emu.regs_mut().set_eip(0x123123);
emu.regs_mut().set_al(0xff);
emu.regs_mut().set_sil(0xff);
emu.regs_mut().set_dil(0xff);
r1 to r15
let r15 = emu.regs().r15();
let n = emu.regs().get_r12w();
emu.regs_mut().set_r8h(0x00);
emu.regs_mut().set_r8l(0xff);
emu.regs_mut().r8 = 0;
let lower_32bits = emu.regs().set_r8d();
let upper_32bits = emu.regs().set_r8u();
Regs64 is fully featured, there are also some uncommon registers like ymm, cr, gs, fs, tr and msr.
helper methods
emu.regs_mut().clear::<u8>(); clear the lower byte of all the registers.
emu.regs_mut().rand(); randomize register values.
emu.regs().print::<u32>(); print main registers.
And there are much more stuff, for more check the Regs64 object.
Note that you can change emu.regs_mut().set_eip(addr); but most of times what you really need is emu.set_eip(addr); which emulates the jmp logic triggering WinAPI if the address is a lib.
Memory operations
It could be useful for pinpoint the emulation state before starting the emulation, but other option is checking the memory after the emulation or altering it during the emulation.
Note that this read/write are inside the emulation virtual memory.
emu.maps.read_byte(addr: u64) -> Option<u8>emu.maps.read_f64(addr: u64) -> Option<f64>emu.maps.read_f32(addr: u64) -> Option<f32>emu.maps.read_128bits_be(addr: u64) -> Option<u128>emu.maps.read_128bits_le(addr: u64) -> Option<u128>emu.maps.read_qword(addr: u64) -> Option<u64>emu.maps.read_dword(addr: u64) -> Option<u32>emu.maps.read_word(addr: u64) -> Option<u16>emu.maps.read_buffer(from: u64, sz: usize) -> Vec<u8>emu.maps.read_bytes(addr: u64, sz: usize) -> &[u8]emu.maps.read_bytes_option(addr: u64, sz: usize) -> Option<&[u8]>emu.maps.read_string_of_bytes(addr: u64, sz: usize) -> Stringemu.maps.read_string(addr: u64) -> Stringemu.maps.read_wide_string_nocrash(addr: u64) -> Stringemu.maps.read_wide_string(addr: u64) -> Stringemu.maps.read_wide_string_n(addr: u64, max_chars: usize) -> Stringemu.maps.write_byte(addr: u64, value: u8) -> boolemu.maps.write_qword(addr: u64, value: u64) -> boolemu.maps.write_dword(addr: u64, value: u32) -> boolemu.maps.write_word(addr: u64, value: u16) -> boolemu.maps.write_bytes(addr: u64, data: Vec<u8>) -> boolemu.maps.write_string(to: u64, from: &str)emu.maps.write_wide_string(to: u64, from: &str)emu.maps.write_buffer(to: u64, from: &[u8])emu.maps.write_spaced_bytes(addr: u64, sbs: &str) -> boolemu.maps.memset(addr: u64, b: u8, amount: usize)emu.maps.memcpy(to: u64, from: u64, size: usize) -> boolemu.maps.sizeof_wide(unicode_str_ptr: u64) -> usizeemu.maps.search_string(kw: &str, map_name: &str) -> Option<Vec<u64>>emu.maps.search_spaced_bytes_from(sbs: &str, saddr: u64) -> u64emu.maps.search_spaced_bytes_from_bw(spaced_bytes: &str, start_address: u64) -> u64emu.maps.search_spaced_bytes(sbs: &str, map_name: &str) -> Vec<u64>emu.maps.search_spaced_bytes_in_all(sbs: &str) -> Vec<u64>emu.maps.search_string_in_all(kw: String)emu.maps.search_bytes(bkw: Vec<u8>, map_name: &str) -> Vec<u64>
memory read
memory write
libc style memory operations:
search methods:
Examples of preparing context previous to start emulation:
let mut some_data_structure_needed: Vec
Another example:
let mut emu = libmwemu::emu32();
let addr = emu.alloc("buff1", 100);
emu.maps.write_string(addr, "Hello MWEMU!");
let text = emu.maps.read_string(addr, 12);
println!("{}", text);

// Write dword
let buffer_addr = emu.alloc("buff2", 4);
emu.maps.write_dword(buffer_addr + 0x100, 0x12345678);
let value = emu.maps.read_dword(buffer_addr + 0x100);
println!("dword: 0x{:x}", value);

// emulate some opcodes
let buff = emu.alloc("code_blob", 1024);
let opcodes = vec![0x90, 0x90, 0x90, 0xc3]; // nop nop nop ret
emu.maps.write_buffer(buff, opcodes);
emu.regs_mut().set_eip(buff);
emu.run(Some(buff+3));
println!("eip: 0x{:x}", emu.regs().get_eip());
// just an example, probalby more convinient using emu.load_code_bytes(&opcodes) for emulating shellcode that is in a variable.
Start Emulation
Once everything is configured, you can start the emulation.
emu.run(end_addr: Option<u64>) -> Result<u64, MwemuError>emu.run_until_ret() -> Result<u64, MwemuError>emu.run_to(end_pos: u64) -> Result<u64, MwemuError>emu.run_multi_threaded(end_addr: Option<u64>) -> Result<u64, MwemuError>emu.run_single_threaded(end_addr: Option<u64>) -> Result<u64, MwemuError>emu.stop()emu.call32(addr: u64, args: &[u32]) -> Result<u32, MwemuError>microsoft 32bits calling convention.emu.call64(addr: u64, args: &[u64]) -> Result<u64, MwemuError>microsoft 64bits calling convention.emu.linux_call64(addr: u64, args: &[u64]) -> Result<u64, MwemuError>ABI SysV AMD64 calling conventionused on linux64 user space.emu.step() -> boolemu.step_single_threaded() -> boolemu.step_multi_threaded() -> bool
You can start the mulation using run functions
But this ways is wide more confortable because mimics calling conventions.
For more control but slow way you can use step, but note that also can use hooks.
Additional Useful Methods
Other helpful stuff for emulation control:
emu.posthis is the emulated instruction counter, you can access even modify it.emu.set_verbose(n: u32)set verbose 0 for go faster to a specific point and then set 2 to view the asm only in that pos ranges.emu.cfg.console_enabled = trueenable the console autospawn.emu.spawn_console()in specific case spawn the console to inspect manually the situation.
fn main() {
    let mut emu = limwemu::emu64();
    emu.init_logger();
    emu.load_code("/bin/ls.static");
    emu.cfg.console_enabled = true;
    emu.run(None).unwrap();
    emu.spawn_console();
}
let mut emu = libmwemu::emu64();
let vm_buff = emu.alloc("buff", 1024, Permission::READ_WRITE_EXECUTE);
let vm: Vec
fn main() {
    let mut emu = limwemu::emu64();
    emu.init_logger();
    emu.load_code("/bin/ls.static");
    emu.cfg.console_enabled = true;
    emu.run(None).unwrap();
    emu.spawn_console();
}
Stack operations
There are methods for altering the stack, note that you also could do with emu.maps writes.
But with this meethods you trigger all the stack logic, also incrementing rsp/esp.
stack_push32(value: u32) -> boolstack_push64(value: u53) -> boolstack_pop32() -> Option<u32>stack_pop64() -> Option<u64>
This example simulates a stack based calling convention, but note that you can also use call32() and call64() and linux_call64() methods.
loop {
    emu.maps.memset(str_buff, 0, 1024);
    emu.maps.memset(str_decoded, 0, 1024);
    emu.regs_mut().set_eip(decrypt_strings_func);
    emu.stack_push32(i);
    emu.stack_push32(str_buff as u32);
    emu.stack_push32(thread_ctx as u32);
    emu.stack_push32(ret_addr as u32);
    emu.run(Some(ret_addr)).unwrap();
    ...
}
Breakpoints
Like a debugger you can configure different types of breakpoints, but the implementation is simple, but are other ways of trigger the emulation to stop.
emu.bp.show()emu.bp.clear_bp()emu.bp.add_bp(addr: u64)emu.bp.addr.clone()get a vector of address based breakpoints.emu.bp.add_bp_instruction(ins: u64)emu.bp.instruction.clone()emu.bp.add_bp_mem_read(addr: u64)emu.bp.mem_read_addr.clone()emu.bp.add_bp_mem_write(addr: u64)emu.bp.mem_write_addr.clone()
For more info check Breakpoint object reference.
Memory dump
there are several ways do do a memory dump
emu.maps.save_all_allocs(path: &str)only save to disk allocations done by the emulated code.emu.maps.save(addr: u64, size: u64, filename: String)dump specific blob to disk.
Example
emu.maps.print_maps()
emu.maps.save(0x40324234, 1024, "/tmp/blob.bin")
View info
There are some less used methods to fetch different type of information.
let mut output = String::new();
self.emu
    .formatter
    .format(&self.emu.instruction.unwrap(), &mut output);
get last emulated mnemonic.emu.pos = 0;reset the emulated instruction count to zero.emu.cfg.is_64bitsdetect in which mode is the emulator.emu.disassemble(addr: u64, amount: u32) -> Stringdissassemble bytes.emu.maps.print_maps()print all the maps (allocs, linked dlls, etc)emu.maps.print_maps_keyword(kw: &str)print the maps that contain a keyword.let base = match emu.maps.get_addr_base(addr) { Some(v) => Ok(v), None => ..., };emu.maps.is_mapped(addr: u64) -> boolcheck if an address is allocated.emu.maps.get_addr_name(addr: u64) -> Stringget in which map name is the address.emu.maps.dump(addr: u64)print bytes.emu.maps.dump_n(addr: u64, amount: u64)print n bytes.emu.maps.dump_qwords(addr: u64, n: u64)print a list of qwords.emu.maps.dump_dwords(addr: u64, n: u64)print a list of dwords.emu.maps.size() -> usizeshow the total allocated memory.emu.maps.overlaps(addr: u64, sz: u64) -> boolcheck if a memory block overlaps with existing map.emu.maps.show_allocs()print all the allocations done by the emulated code.emu.maps.mem_test() -> booldo a automatic memory test to look for map overlapps.emu.api_addr_to_name(addr: u64) -> Stringprovide an address pointing to an API and will fetch the API name.emu.api_name_to_addr(name: &str) -> u64get the address of an api name.
Example
let name = emu.api_addr_to_name(0x11223344)
println!("{}", name)
   MessageBoxA
Switch architecture bits.
There are methods for changing from 32bits to 64bits and vice versa.
set_64bits()set_32bits()inspect_seq(s: str)
But better don't change the architecture on the fly, re-instantiate the emulation object like:
Example
let mut emu = libmwemu::emu64();
...
let mut emu = libmwemu::emu32();
Or even create both objtects.
Hooks
The Hooks object allow to extend the emulator without blockign the emulation.
emu.hooks.on_memory_read(trace_memory_read);the hook is triggered after every read.emu.hooks.on_memory_write(trace_memory_write);the hook is triggered before every write, and the hook can change the value to write by returning it.emu.hooks.on_interrupt(trace_interrupt);the hook is triggered before handling it, the hook can decide with the return value if mwemu do the handling or not.emu.hooks.on_exception(trace_exceptions);the hook is triggered before handling it, the hook can decide with the return value if mwemu do the handling or not.emu.hooks.on_pre_instruction(trace_pre_instruction);the hook is triggered before emulating the instruction.emu.hooks.on_post_instruction(trace_post_instruction);the hook is triggered after emulating the instruction.emu.hooks.on_winapi_call(trace_winapi_call);you can implement a Windows API.emu.hooks.disable_memory_read();emu.hooks.disable_memory_write();emu.hooks.disable_interrupt();emu.hooks.disable_exception();emu.hooks.disable_pre_instruction();emu.hooks.disable_post_instruction();emu.hooks.disable_winapi_call();
Enable a hook
Disable a hook
Example
use libmwemu::emu32;

//need iced_x86 crate only for instruction hooks, to get the
//instruction object, so cargo add iced-x86
use iced_x86::{Instruction};

fn trace_memory_read(emu:&mut libmwemu::emu::Emu, ip_addr:u64,
                     mem_addr:u64, sz:u8) {
    log::info!("0x{:x}: reading {} at 0x{:x}", ip_addr, sz, mem_addr);
    if mem_addr == 0x22dff0 {
        emu.stop();
    }
}

fn trace_memory_write(emu:&mut libmwemu::emu::Emu, ip_addr:u64,
                      mem_addr:u64, sz:u8, value:u128) -> u128 {
    log::info!("0x{:x}: writing {} '0x{:x}' at 0x{:x}", ip_addr, sz,
             value, mem_addr);
    value   // I could change the value to write
}

fn trace_interrupt(emu:&mut libmwemu::emu::Emu, ip_addr:u64,
                   interrupt:u64) -> bool {
    log::info!("interrupt {} triggered at eip: 0x{:x}", interrupt,
             ip_addr);
    true  // do handle interrupts
}

fn trace_exceptions(emu:&mut libmwemu::emu::Emu, ip_addr:u64, ex_type: libmwemu::exception_type::ExceptionType) -> bool {
    log::info!("0x{:x} triggered an exception {}", ip_addr, ex_type);
    if (ex_type == libmwemu::exception_type::ExceptionType::Int3) {
        // do handle SIGTRAP for example
    }
    true // do handle exceptions
}

fn trace_pre_instruction(emu:&mut libmwemu::emu::Emu, ip_addr:u64,
                         ins:&Instruction, sz:usize) -> bool{
                            // return false to skip the instruction
                            true
}

fn trace_post_instruction(emu:&mut libmwemu::emu::Emu, ip_addr:u64,
                          ins:&Instruction, sz:usize, emu_ok:bool) {
}

fn trace_winapi_call(emu:&mut libmwemu::emu::Emu, ip_addr:u64, api_addr:u64) -> bool {
    return true; // handle api calls
}

fn main() {
    let mut emu = emu32();
    emu.set_maps_folder("../mwemu/maps32/"); // download the maps, ideally from mwemu git.
    emu.init();

    emu.load_code("/home/sha0/src/mwemu/shellcodes32/mars.exe");
    emu.hooks.on_memory_read(trace_memory_read);
    emu.hooks.on_memory_write(trace_memory_write);
    emu.hooks.on_interrupt(trace_interrupt);
    emu.hooks.on_exception(trace_exceptions);
    emu.hooks.on_pre_instruction(trace_pre_instruction);
    emu.hooks.on_post_instruction(trace_post_instruction);
    emu.hooks.on_winapi_call(trace_winapi_call);
    emu.run(None).unwrap();
    log::info!("end!");
}